プロメテウス本体とエクスポータのインストール
Ubuntu24.04.2LTSにプロメテウスをインストールします。
サーバへログインし、以下のコマンドを実行。
~$ sudo apt -y install prometheus prometheus-node-exporteプロメテウス本体と、サーバ、CPU、メモリ等の一般的リソース情報の取得を行うnode-exporterがインストールされます。
プロメテウス基本設定
プロメテウスの基本設定は/etc/prometheus/promrtheus.ymlに記載されています。
インストール直後の内容は以下の通り。
 Sample config for Prometheus.

global:
  scrape_interval:     15s # Set the scrape interval to every 15 seconds. Default is every 1 minute.
  evaluation_interval: 15s # Evaluate rules every 15 seconds. The default is every 1 minute.
  # scrape_timeout is set to the global default (10s).

  # Attach these labels to any time series or alerts when communicating with
  # external systems (federation, remote storage, Alertmanager).
  external_labels:
      monitor: 'example'

# Alertmanager configuration
alerting:
  alertmanagers:
  - static_configs:
    - targets: ['localhost:9093']

# Load rules once and periodically evaluate them according to the global 'evaluation_interval'.
rule_files:
  # - "first_rules.yml"
  # - "second_rules.yml"

# A scrape configuration containing exactly one endpoint to scrape:
# Here it's Prometheus itself.
scrape_configs:
  # The job name is added as a label `job=<job_name>` to any timeseries scraped from this config.
  - job_name: 'prometheus'

    # Override the global default and scrape targets from this job every 5 seconds.
    scrape_interval: 5s
    scrape_timeout: 5s

    # metrics_path defaults to '/metrics'
    # scheme defaults to 'http'.

    static_configs:
      - targets: ['localhost:9090']

  - job_name: node
    # If prometheus-node-exporter is installed, grab stats about the local
    # machine by default.
    static_configs:
      - targets: ['localhost:9100']
自動起動を有効に
以下のコマンドでプロメテウス本体、ノードエクスポータを自動起動するように。
~$ sudo systemctl enable prometheus prometheus-node-exporter稼働確認
http://インストールサーバのIPアドレス:9090/へアクセスすると、以下のような画面が表示される。
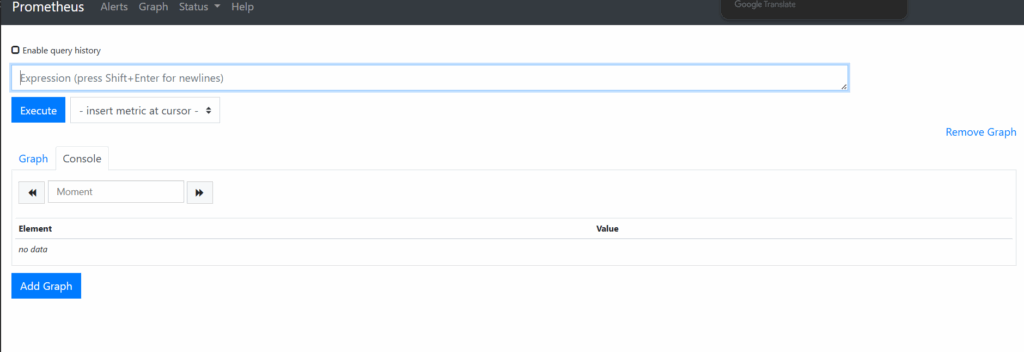
画面が表示されない場合はインストールに失敗している可能性があるので、もう一度頑張って。
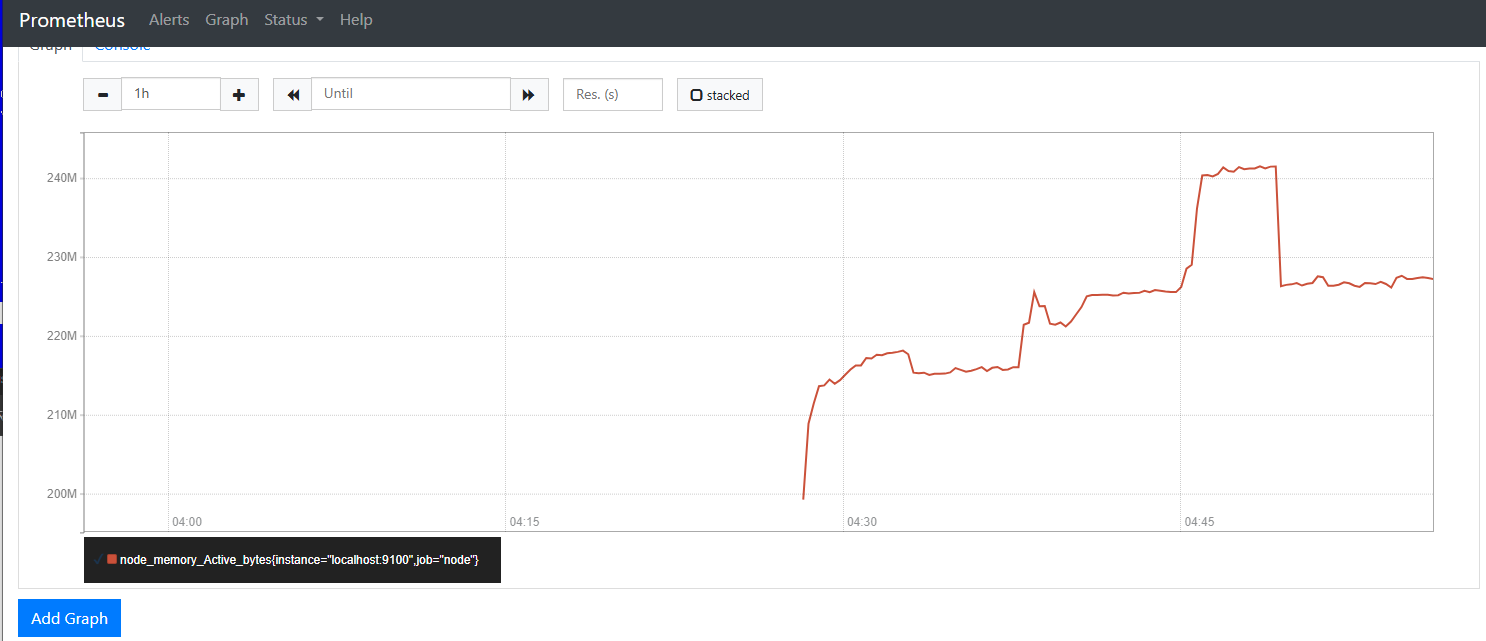
エクスポータの動作確認
Execute横のプルダウンから適当に選択し、以下の様にグラフが描かれえば確認完了。
監視項目の詳細は別の機会で。